That single fact shapes nearly every smart buying and selling decision you can make.
Here is what the curve looks like in practice:
- Year 1: A new car typically drops about 20% the moment it leaves the lot, according to Kelley Blue Book (KBB).
- Years 2–5: Value continues to fall at a slower pace, so cumulative loss is substantial by year five.
- Years 6 and beyond: Annual depreciation slows to about 8–12%, and the curve flattens considerably.
The single best immediate action: run your vehicle through a depreciation calculator (KBB, CarEdge, or Carfax) before you buy, sell, or trade in. If you are shopping now, a car that is 2–3 years old has already absorbed the steepest part of that drop, which means you pay less for nearly the same vehicle.
Key Takeaways
The steepest depreciation happens in year one, making a 2–3 year old inspected used car the strongest value position for most buyers.
| Point | Details |
|---|---|
| Year-one drop | New cars lose roughly 20% of value in the first year, per KBB. |
| Five-year cumulative loss | Expect high-50% total depreciation by year five on an average vehicle. |
| Top levers to slow loss | Documented service history, mileage management, and prompt cosmetic repairs preserve resale value. |
| Best buying window | A 2–3 year old used car avoids the steepest drop and starts you on a flatter curve. |
| Elmwoodautosalesri advantage | Inspected pre-owned inventory with documented history gives buyers a confidence premium and a lower cost basis. |
Table of Contents
- How does the car depreciation curve work, year by year?
- Why does the curve drop so steeply at first, then flatten?
- What factors change your car's depreciation curve?
- How to estimate your car's future value
- How depreciation should shape your ownership decisions
- Practical ways to slow your car's depreciation
- Which tools give you the most reliable depreciation data?
- Why Elmwoodautosalesri recommends buying inspected pre-owned
- The depreciation curve as a personal buying decision
- Elmwoodautosalesri's inspected pre-owned inventory in Providence
- Sources
How does the car depreciation curve work, year by year?
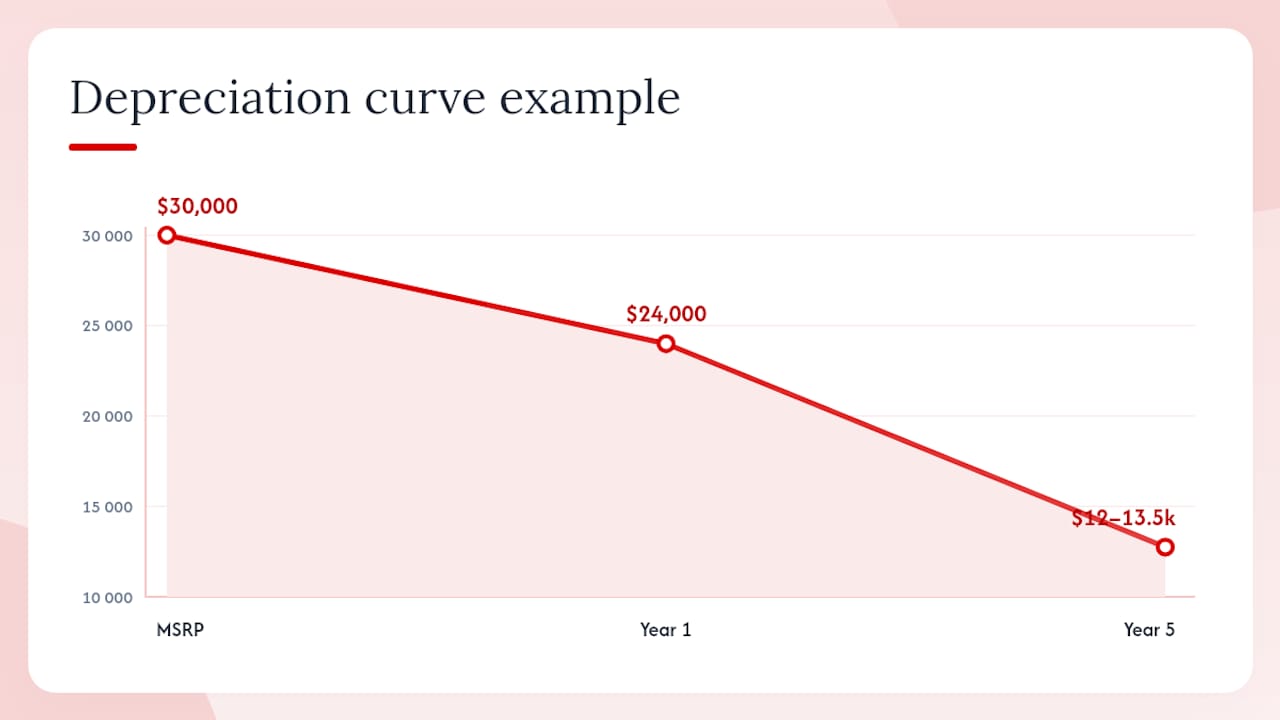
Understanding car depreciation means understanding a curve, not a straight line. Value falls fastest in the first 12 months, then the rate of loss slows each subsequent year.
Two worked examples show how this plays out in real dollars.
Example 1: $30,000 MSRP. After year one, the car is worth roughly $24,000. By year five, it sits near $12,000–$13,500, a loss of more than $16,000 from the sticker price.
Example 2: $50,000 MSRP. After year one, the car is worth roughly $40,000. By year five, it has dropped to around $20,000–$22,500, meaning the owner absorbed $27,500–$30,000 in depreciation alone.
CarCostBreakdown reports average first-year declines near 20–25% and five-year losses commonly in the high-50% range, though the exact figure depends heavily on the model. Luxury vehicles and certain truck segments can fall faster or slower than the averages above. The table gives you a reliable starting point; a model-specific calculator refines it.
Why does the curve drop so steeply at first, then flatten?
The steep early drop comes from one thing: the loss of "new car" status. The moment a vehicle is titled and driven off the lot, it becomes a used car competing against every other used car on the market. Buyers who want a new car will pay a new-car price; buyers who want a used car will not.
Rapid model-year turnover compounds this. Automakers release updated versions annually, which makes the current-year model feel dated almost immediately. That perception alone pushes the resale price down faster than any mechanical wear.
From years two through five, the forces shift. Supply, durable demand, and perceived running cost take over. A three-year-old car with 35,000 miles is a known quantity: buyers can check its reliability record, find parts easily, and estimate maintenance costs. That predictability supports the price, which is why the curve flattens.
Market anomalies can temporarily reverse the pattern. The 2021–2023 semiconductor shortage pushed used-car prices sharply upward because new inventory dried up, as Jalopnik documented. Those conditions were an exception driven by supply disruption, and prices largely corrected as supply normalized. Treat any short-term spike as noise, not a new baseline.
Eventually, a car reaches what analysts call the "crossover point," where the annual cost of depreciation roughly equals the annual cost of maintenance. Past that point, keeping the car often makes more financial sense than selling it, because you stop losing meaningful value while your transportation costs stay predictable.
What factors change your car's depreciation curve?
The averages above describe a typical vehicle. Your specific car can land well above or below those numbers depending on five variables.
- Age and new-car premium. The first-year drop is the largest single factor. A car that is one day old and titled is already worth less than the same car untitled on the lot.
- Mileage. The FHWA national average runs roughly 12,000–15,000 miles per year. Every 10,000 miles above that average reduces resale value by roughly 1–2%, according to CarCostBreakdown's mileage rule of thumb.
- Condition and vehicle history. A clean Carfax report is worth real money. Vehicles with accident or salvage history can lose 10–25% of their value compared to a clean-title equivalent, per CarCostBreakdown.
- Brand and reliability reputation. Models with strong reliability records, particularly certain Japanese makes, consistently retain more value because buyers trust their long-term running costs. Check reliable used car brands for data-backed rankings.
- Market and technology shifts. Rising fuel prices hurt large SUV and truck resale values; falling fuel prices help them. Electric vehicle adoption has introduced battery-range anxiety as a depreciation factor for older EVs, where buyers discount the price to account for potential battery replacement costs.
Pro Tip: Neutral or silver exterior colors tend to hold resale value better than niche colors like yellow or bright green, simply because the pool of interested buyers is larger.
How to estimate your car's future value
A back-of-envelope estimate takes three steps.
- Start with the current market value. Use KBB's private-party or trade-in tool to establish today's baseline, not the original MSRP.
- Apply year-by-year retention rates. Multiply the current value by the retention rate for each year ahead: roughly 80% after year one, 68% after year two, 58% after year three, and 40–45% after year five (from the curve table above).
- Adjust for mileage and condition. If you drive significantly more than 13,500 miles per year, reduce the estimate by 1–2% for each 10,000 miles above average. A documented service history and clean title support the higher end of any range.
Worked example: $40,000 car over five years.
For trade-in planning, loan decisions, or lease comparisons, a calculator gives you more precision than this method. Experian notes that estimates vary by source and model, with some tools showing five-year losses anywhere from 40% to 60%, so running two or three calculators and averaging the results is a sound approach.
State Farm's depreciation guidance recommends using a calculator specifically when you are deciding whether to buy, sell, or keep a vehicle, because the numbers change the math on financing and insurance in ways a rough estimate can miss.
How depreciation should shape your ownership decisions
New vs. Used. You get nearly the same vehicle for significantly less money, and your own depreciation curve starts at a much gentler slope. The case for pre-owned vehicles is largely a depreciation argument.
Lease vs. buy. Lease payments are essentially a structured payment for the depreciation that occurs during the lease term, plus interest and fees. Buying outright means you own the remaining value at the end, which can be an asset if the car holds up well.
Trade-in timing. The 2–5 year window is generally the sweet spot. Before two years, you are still in the steepest part of the curve and will take a larger loss on trade-in. After five years, the car's value has stabilized, but so has your leverage, since the remaining value is smaller. For a detailed look at which models hold trade-in value best, the top trade-in value vehicles guide is worth reviewing before you negotiate.
Insurance implications. When an insurer pays out a total-loss claim, they pay actual cash value (ACV), which reflects the car's depreciated market value, not what you paid or what you owe. If you financed a new car and it is totaled in year one, you could owe more on the loan than the ACV payout covers. Gap insurance covers that difference, and it is most relevant in the first two years of ownership when depreciation is steepest, as Progressive's depreciation guidance explains.
Practical ways to slow your car's depreciation
No owner can stop depreciation, but several habits measurably reduce the rate.
- Keep a documented service history. Every oil change, brake job, and inspection logged with receipts reduces buyer uncertainty and supports a higher asking price. A well-documented car signals reliability in a way that a verbal assurance cannot.
- Stay near the mileage average. Driving significantly above 13,500 miles per year accelerates value loss. If you have a second vehicle, routing longer trips through the higher-mileage car can protect the lower-mileage one's resale value.
- Fix cosmetic damage promptly. A small dent or cracked bumper cover that costs $300 to repair can reduce a trade-in offer by $800–$1,000 because dealers price for uncertainty. Fixing it before listing or trading in almost always pays off.
- Choose popular colors and sensible trims. Mid-range trims often retain a higher percentage of their original cost than top trims, because used-car buyers rarely pay the full new-car premium for loaded features. A well-equipped mid-trim in a neutral color is typically the strongest resale choice.
- Store the car properly. Garage storage protects paint and interior from UV damage, which is a visible depreciation factor that buyers notice immediately.
Pro Tip: Before trading in or selling, pull a Carfax report on your own vehicle. Knowing what a buyer will see lets you address any surprises before they become negotiating leverage against you.
Which tools give you the most reliable depreciation data?
Four resources cover most of what you need, and each has a distinct strength.
Kelley Blue Book (KBB) is the most widely recognized valuation tool in the U.S. Its trade-in and private-party values are what most dealers reference, making it the right starting point for any negotiation or trade-in conversation.
CarEdge provides model-level depreciation curves and future-value projections, which makes it particularly useful when you are comparing two vehicles and want to see which one holds value better over a specific time horizon.
Carfax focuses on vehicle history rather than valuation, but its accident and ownership records directly affect the depreciation calculation. A clean Carfax report is a documented asset; a flagged one is a documented liability.
iSeeCars aggregates large volumes of actual transaction data and publishes depreciation rankings by make and model. It is especially useful for identifying which specific models outperform or underperform the averages.
For mileage benchmarking, the FHWA Highway Statistics database provides the national average annual mileage figures that underpin most mileage-adjustment calculations. Knowing whether your vehicle is above or below the ~13,500-mile annual average is the first step in any mileage-adjusted valuation.
All calculators produce estimates. Actual resale value depends on local market conditions, the specific buyer pool, and the vehicle's condition on the day of sale.
Why Elmwoodautosalesri recommends buying inspected pre-owned
At Elmwoodautosalesri, the case for buying a 2–3 year old inspected vehicle is not just about price. It is about entering the ownership curve at the right point.
Every vehicle in Elmwoodautosalesri's inventory goes through a thorough inspection before it reaches the lot. That process covers:
- Mechanical systems: engine, transmission, brakes, and suspension
- Safety components: lights, tires, and airbag systems
- Cosmetic condition: interior and exterior reviewed and documented
- Vehicle history: Carfax report reviewed for accidents, title issues, and prior ownership
Add a documented inspection and a clean vehicle history report, and that buyer also has the paper trail that supports resale value when they eventually sell or trade in. That documentation is what Elmwoodautosalesri calls the "confidence premium," and it is built into every vehicle on the lot.
Financing options, including in-house arrangements for a range of credit profiles, mean that the math on a pre-owned purchase is accessible to more buyers than a new-car loan often is. What to expect at a used car dealership walks through the full process if you want to know what an Elmwoodautosalesri visit looks like before you arrive.
Pro Tip: Ask to see the inspection checklist and the Carfax report before you discuss price. A dealer who provides both without hesitation is one you can trust.
The depreciation curve as a personal buying decision
The curve is most useful when you apply it to a specific choice. If you are deciding between a new $40,000 car and a two-year-old version of the same model at $28,000, the math is straightforward: the used car has already lost roughly $12,000 in value, and you did not have to absorb that loss.
One rule worth keeping: buy 2–3 years old if you want the best value per dollar spent. Keep a car for 5 or more years if you want the lowest total cost of ownership, because the depreciation cost per year drops sharply once the curve flattens. Selling at the 3–4 year mark, before major maintenance costs typically arrive, often captures the best of both positions.
Elmwoodautosalesri's inspected pre-owned inventory in Providence
Buyers who have read this far know the numbers. A 2–3 year old inspected vehicle avoids the steepest depreciation drop, comes with a documented history, and costs significantly less than its new equivalent.
Elmwoodautosalesri's Providence lot carries a curated selection of inspected pre-owned sedans, SUVs, and trucks, each reviewed for mechanical reliability and backed by a vehicle history report. Financing options are available for a range of credit profiles, including in-house arrangements, so the purchase is practical as well as smart. Schedule a test drive today and see which vehicles on the lot fit your value window.
Sources
The figures in this article draw from the following authoritative sources. All calculators produce estimates; actual resale value depends on local market conditions, mileage, and vehicle condition on the day of sale.
- Kelley Blue Book (KBB)
- CarCostBreakdown — Car depreciation explained
- State Farm — Calculate your vehicle depreciation
- FHWA — Highway Statistics
- Experian — What is depreciation on a car?
This article is general information, not a substitute for advice from a qualified financial advisor. Consult a qualified financial professional about your own circumstances before acting on anything here.